Computer-Science
01. Debugging a program
(intel instruction set: refer to http://www.arl.wustl.edu/~lockwood/class/cs306/books/artofasm/Chapter_6/CH06-1.html)
Editing, compiling, running, and debugging a C program in Linux.
Understanding ASM code: where is local variable, stack change during call/ret instruction, ….
Understanding the process image.
0. Background for Buffer Overflow Attack
- Understand
CALL,RETinstruction - x86 instruction set
- Debugging a program at instruction level
- Drawing a memory map
- Using gdb to debug a program
1. Example program: ex1.c
#include <stdio.h>
void main(){
   int x;
   x=30;
   printf("x is %d\n", x);
}
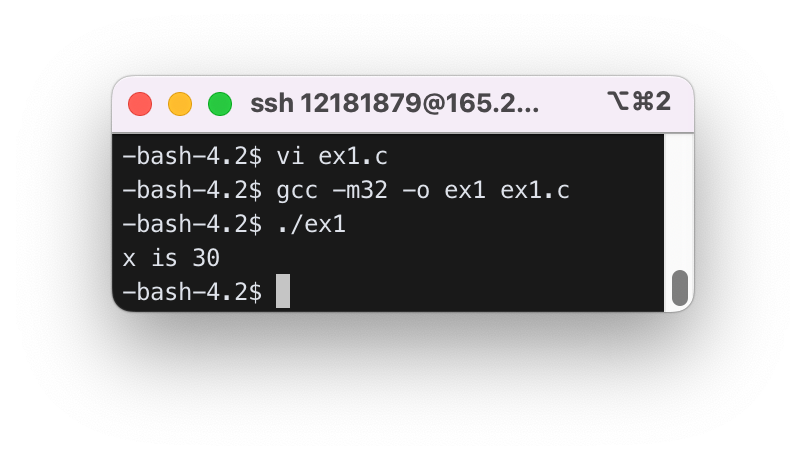
2. Compiling and Running
$ gcc –m32 -o ex1 ex1.c
$ ./ex1
x is 30
3. ASM code
$ objdump -D -M intel ex1 > ex1.txt
$ vi ex1.txt
/main
repeat / until you find “<main>:”
080483c4 <main>:
80483c4: 55                        push   ebp
80483c5: 89 e5                     mov    ebp, esp
80483c7: 83 e4 f0                  and    esp, 0xfffffff0
80483ca: 83 ec 20                  sub    esp, 0x20
80483cd: c7 44 24 1c 1e 00 00 00   mov   DWORD PTR [esp+0x1c], 0x1e
80483d5: b8 b4 84 04 08            mov   eax, 0x80484b4
80483da: 8b 54 24 1c               mov   edx, DOWRD PTR [esp+0x1c]
80483de: 89 54 24 04               mov   DWORD PTR [esp+0x4], edx
80483e2: 89 04 24                  mov   DWORD PTR [esp], eax
80483e5: e8 0a ff ff ff            call   80482f4
80483ea: c9                        leave
80483eb: c3                        ret
......
push x
esp = esp – 4
mem[esp] x
pop x
x mem[esp]
esp = esp + 4
mov reg1, data
reg1 data
and reg, data
reg reg AND data
sub reg, data
reg reg – data
mov DWORD PTR [addr], data
4 byte in mem[addr] data
call x
push return-addr (the address of the instruction after "call x")
jump to x
leave
esp ebp
pop ebp
ret
eip mem[esp]
esp = esp + 4
Exercise
(1) Edit, compile, and run ex1.c.
$ vi ex1.c
$ gcc –m32 -o ex1 ex1.c
$ ./ex1
x is 30
(2) Get ex1.txt as above and show the asm code for main.
$ objdump -D -M intel ex1 > ex1.txt
$ vi ex1.txt
/main
objdump 명령어를 이용해 기계어 파일 ex1을 intel format으로 볼 수 있도록 변환 후, “txt” 형식으로 저장하였다.
- 각 레지스터의 역할은 다음과 같다.
ebp: 스택 시작지점 주소 저장- 베이스 포인터
esp: 스택 끝지점 주소 저장push/pop따라esp값은 4byte 씩 늘었다가 줄었다 함
DWORD PTR:WORD는 2byte,DoubleWORD는 2*2byte- DWORD PTR means DoubleWord Pointer.
- Double word means 4 byte.
mov DWORD PTR [1000], 0x21instruction will store 0x21 in the 4 byte at memory address 1000.
eax: accumulator register – 산술, 논리연산 수행 + 함수 반환값 여기에 저장됨edx: 데이터 복사 시, 목적지의 주소 저장eip: 다음에 실행할 명령어를 가리키는 포인터, 명령 실행 후 자동으로 업데이트 됨
(3) Draw the memory map and show all the changes in registers and memory after each instruction up to the ret instruction.
Assume esp = 0xbffff63c and ebp = 0xbffff6b8 in the beginning of main.
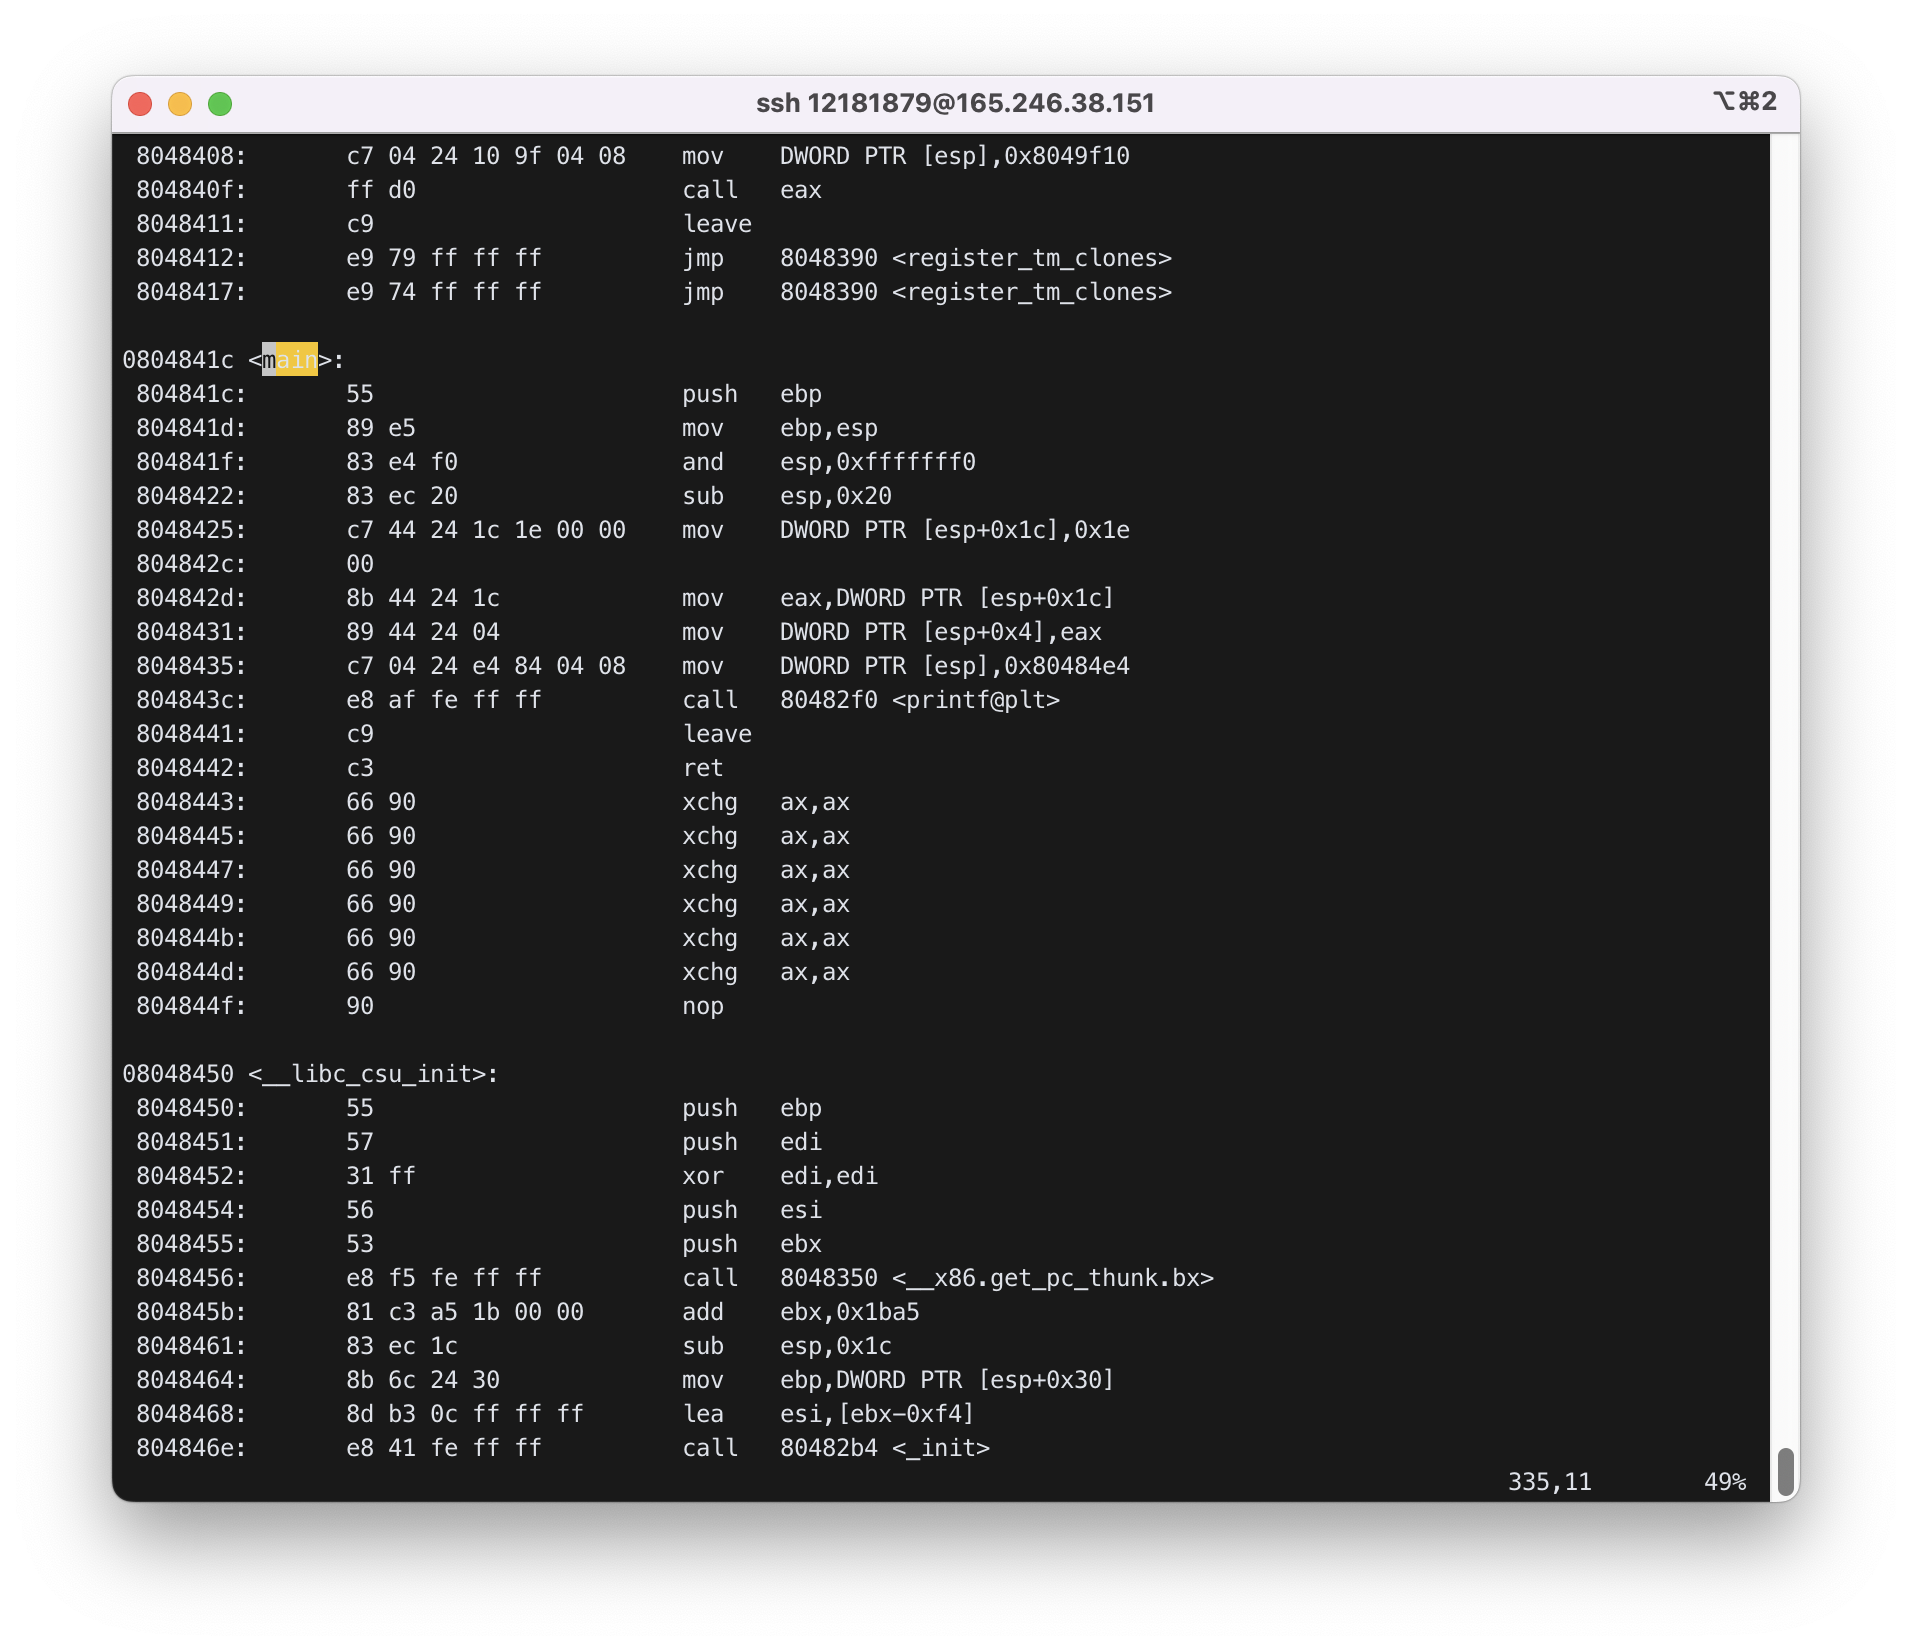
우선, <main> asm 코드는 아래와 같다.
<main> asm code
0804841c <main>:
 804841c:       55                      push   ebp
 804841d:       89 e5                   mov    ebp,esp
 804841f:       83 e4 f0                and    esp,0xfffffff0
 8048422:       83 ec 20                sub    esp,0x20
 8048425:       c7 44 24 1c 1e 00 00    mov    DWORD PTR [esp+0x1c],0x1e
 804842c:       00
 804842d:       8b 44 24 1c             mov    eax,DWORD PTR [esp+0x1c]
 8048431:       89 44 24 04             mov    DWORD PTR [esp+0x4],eax
 8048435:       c7 04 24 e4 84 04 08    mov    DWORD PTR [esp],0x80484e4
 804843c:       e8 af fe ff ff          call   80482f0 <printf@plt>
 8048441:       c9                      leave
 8048442:       c3                      ret
 8048443:       66 90                   xchg   ax,ax
 8048445:       66 90                   xchg   ax,ax
 8048447:       66 90                   xchg   ax,ax
 8048449:       66 90                   xchg   ax,ax
 804844b:       66 90                   xchg   ax,ax
 804844d:       66 90                   xchg   ax,ax
 804844f:       90                      nop
0. Beginning of main
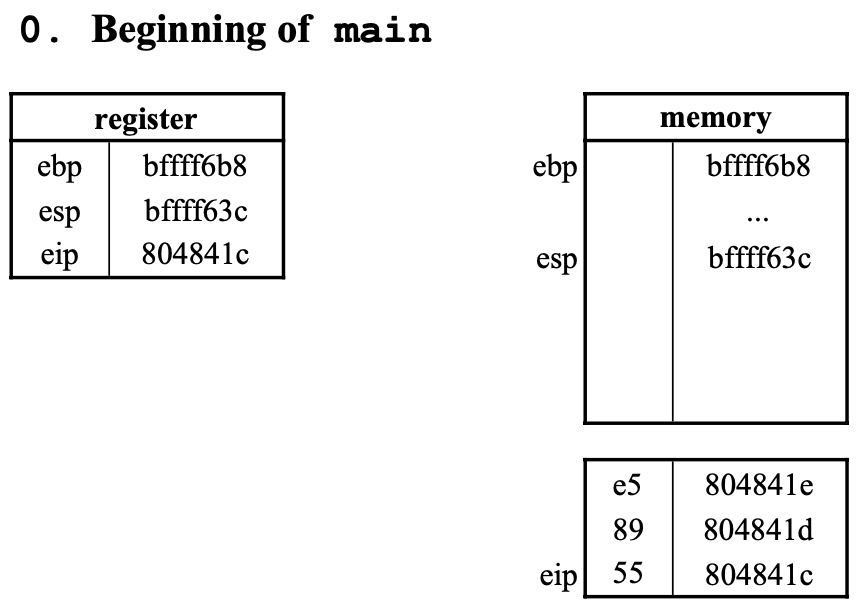
main이804841c부터 시작하므로eip는804841c가 된다.
1. push ebp
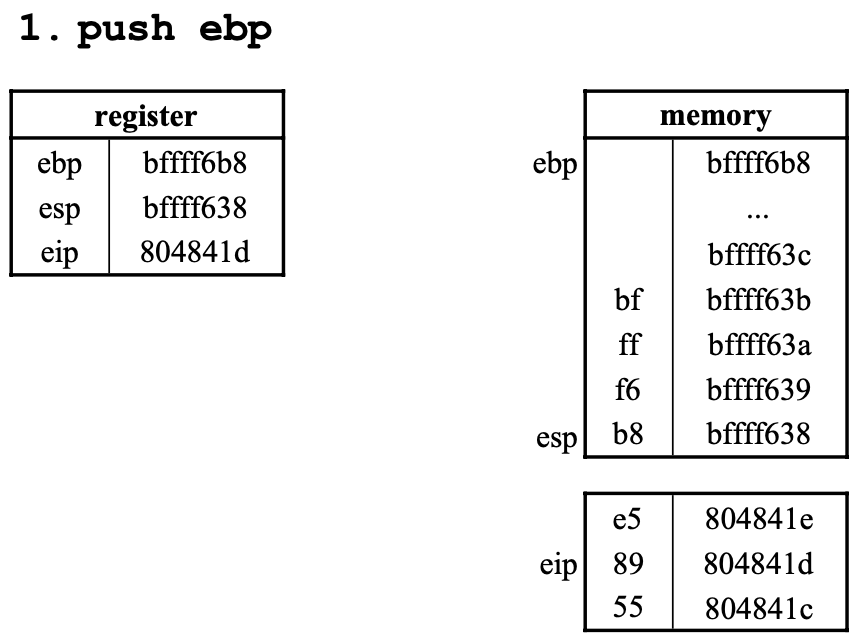
esp를 4만큼 내리고esp가 가리키는 메모리에ebp를 기록한다.eip가 다음으로 하나 이동한다.
2. mov ebp, esp
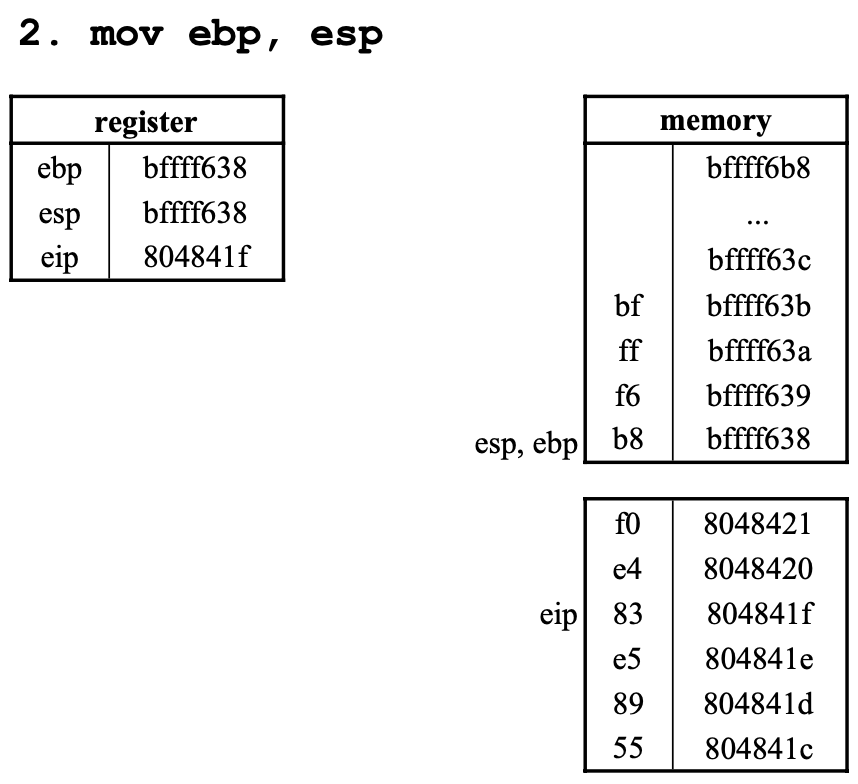
esp값을ebp에 저장(move)한다.
3. and esp,0xfffffff0
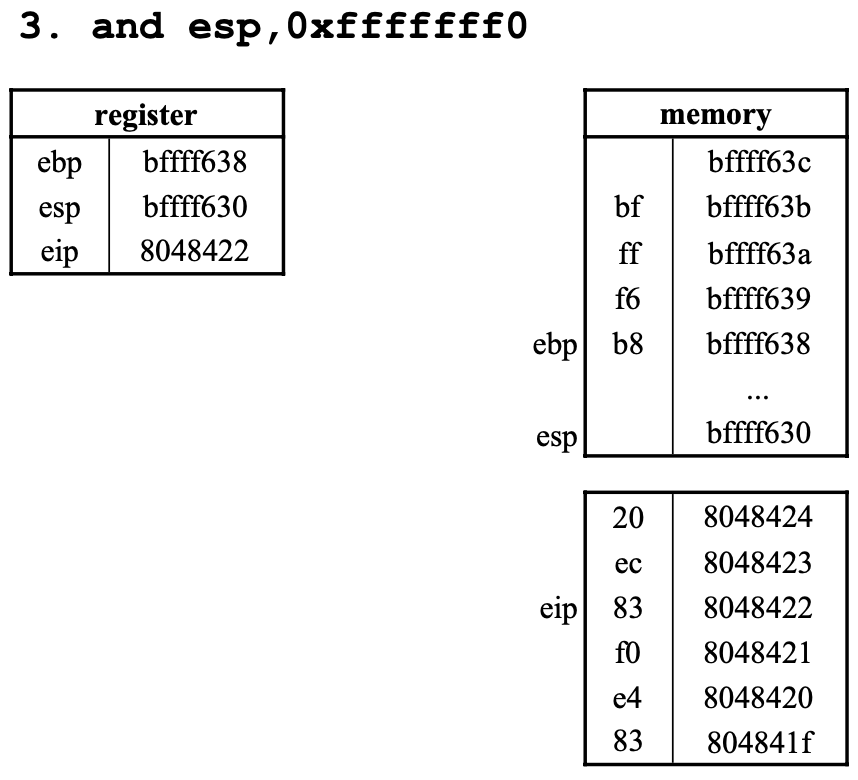
esp값과0xfffffff0값을 비트 별로and연산하고- 그 값을 다시
esp에 집어넣는다 esp는 2진수로10111111111111111111011000111000,0xfffffff0는 2진수로11111111111111111111111111110000이므로and연산을 하면10111111111111111111011000110000==0xbffff630이다.
4. sub esp,0x20
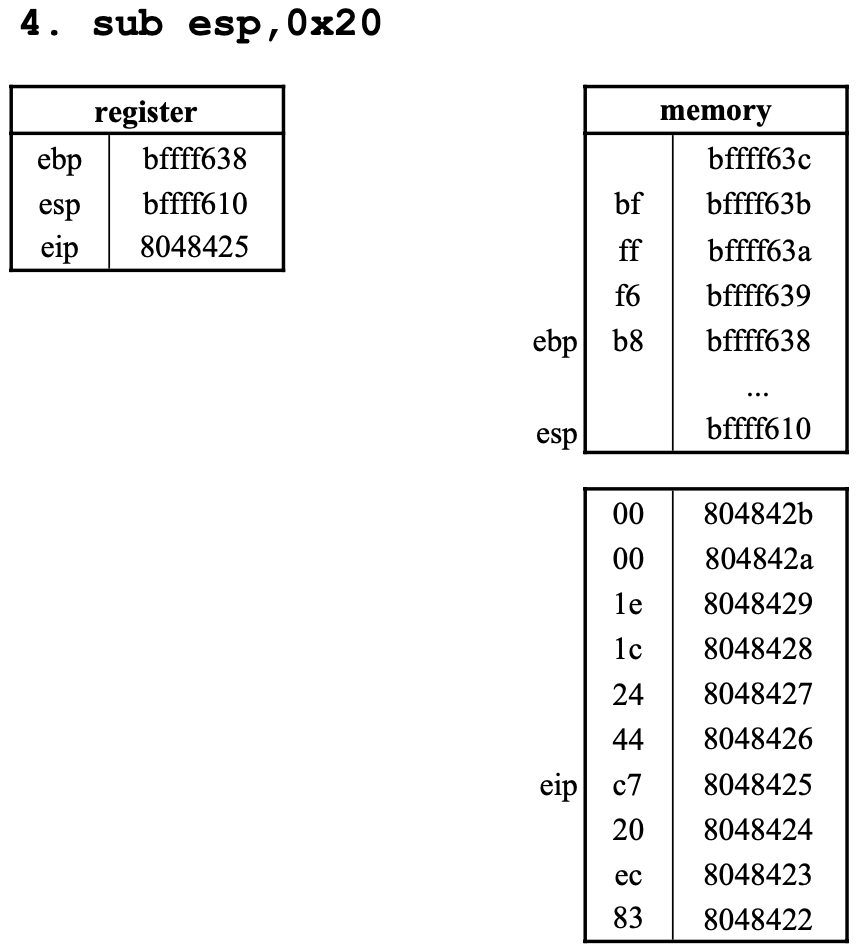
-esp에서 0x20만큼 뺀 값을 esp에 저장한다.
- 이전
esp값인0xbffff630에서0x20만큼 뺀 값은0xbffff610이다.
5. mov DWORD PTR [esp+0x1c], 0x1e
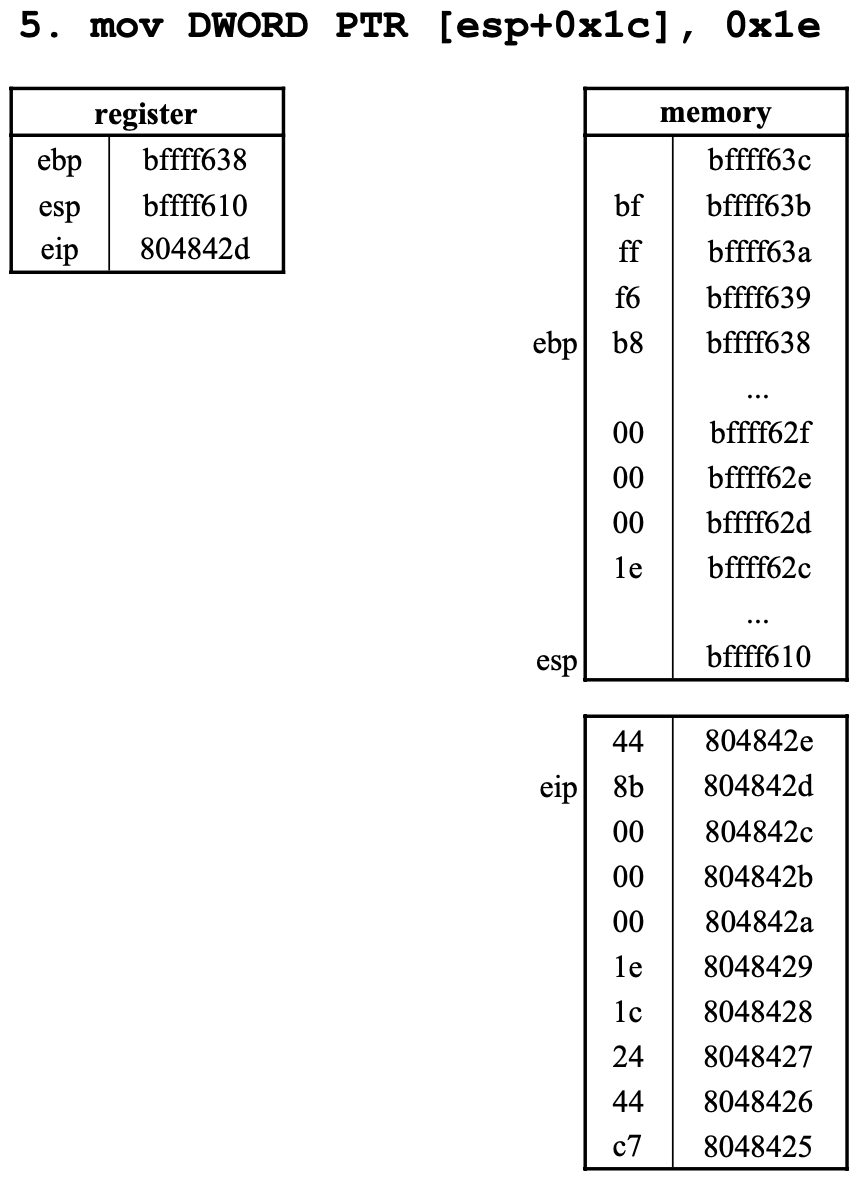
esp값은0xbffff610이다.esp값에0x1c를 더한 값은0xbffff62c이다.
6. mov eax, DWORD PTR [esp+0x1c]
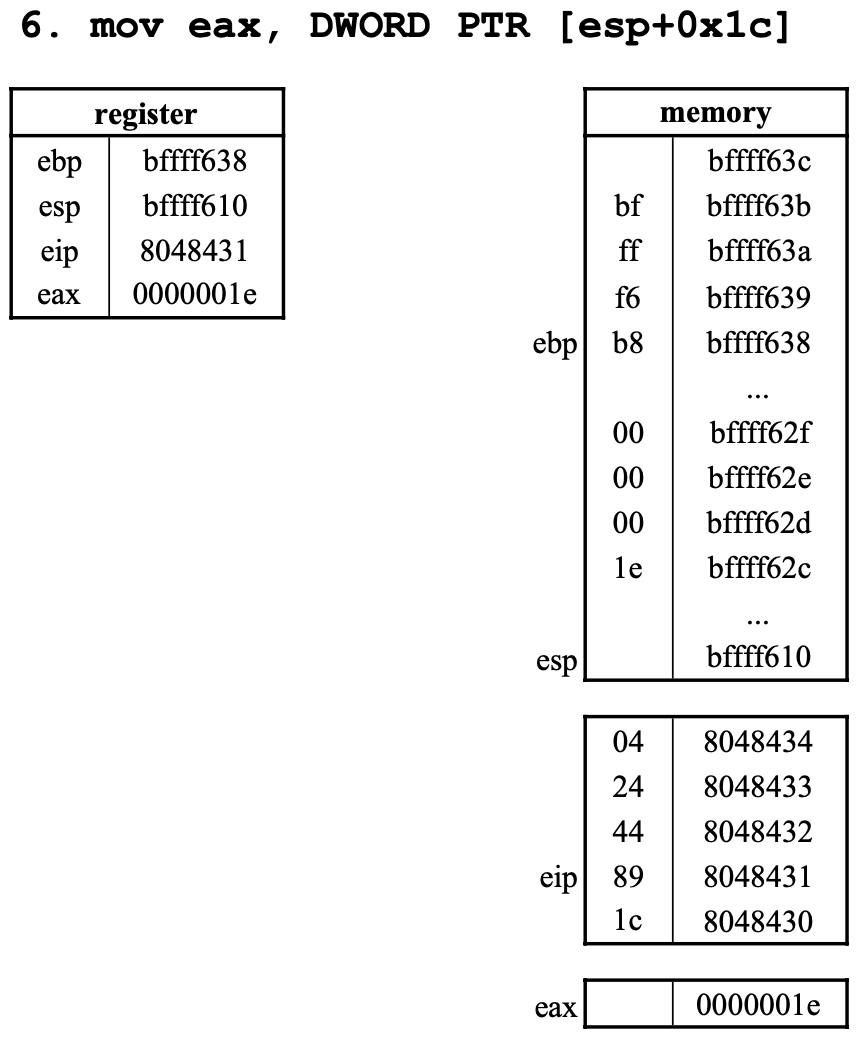
DWORD PTR [esp+0x1c]값을eax에 저장한다.esp값은0xbffff610esp에0x1c를 더하면0xbffff62cDWORD PTR이므로 4byte- 그러므로
eax는0x1e이다.
7. mov DWORD PTR [esp+0x4], eax
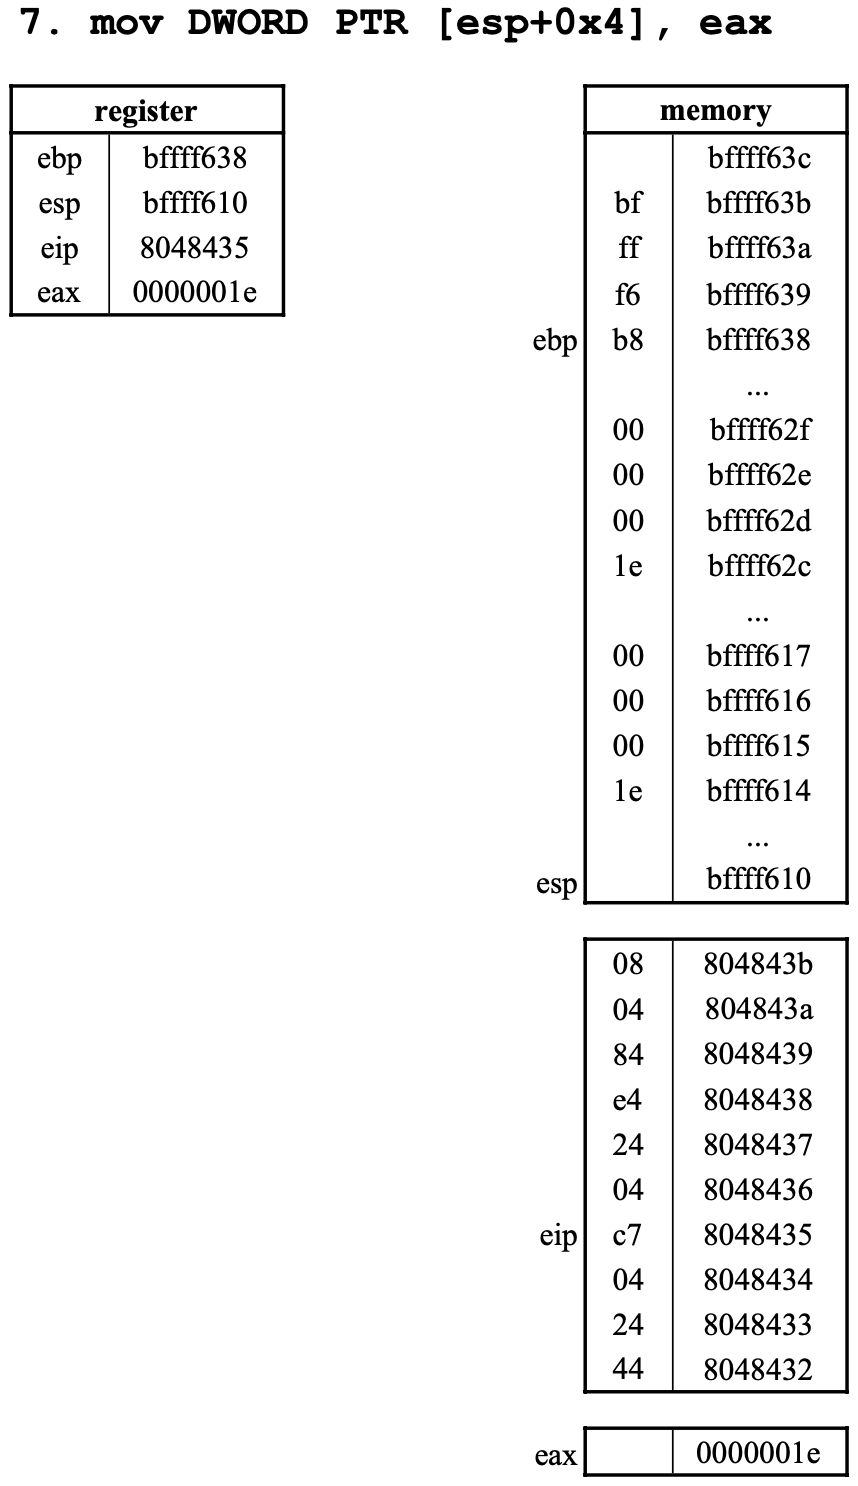
esp+0x4=0xbffff614DWORD PTR이므로 4byte0xbffff614에0x1e를 넣는다.
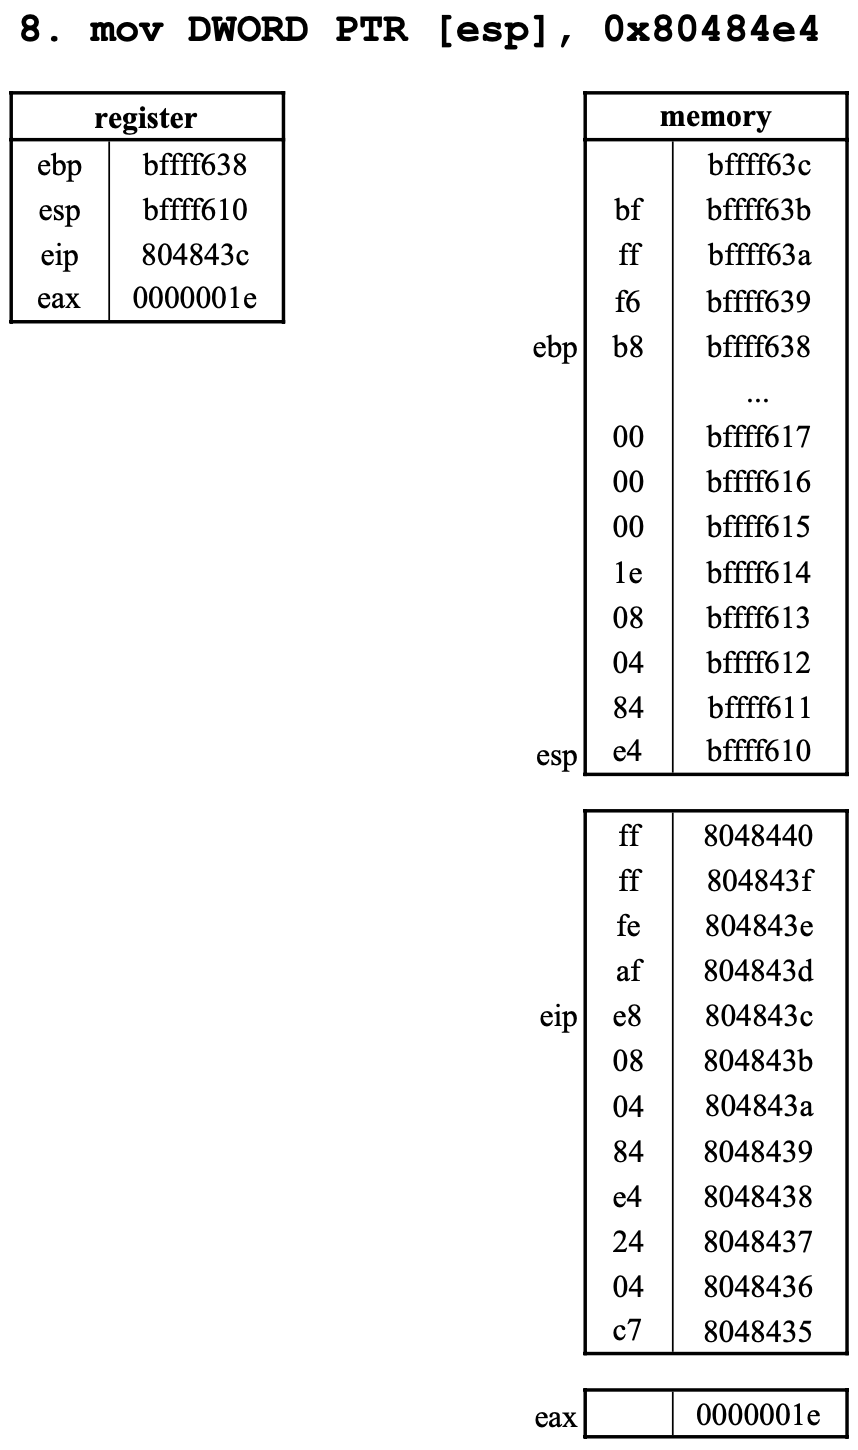
8. mov DWORD PTR [esp], 0x80484e4
9. call 80482f0 <printf@plt>
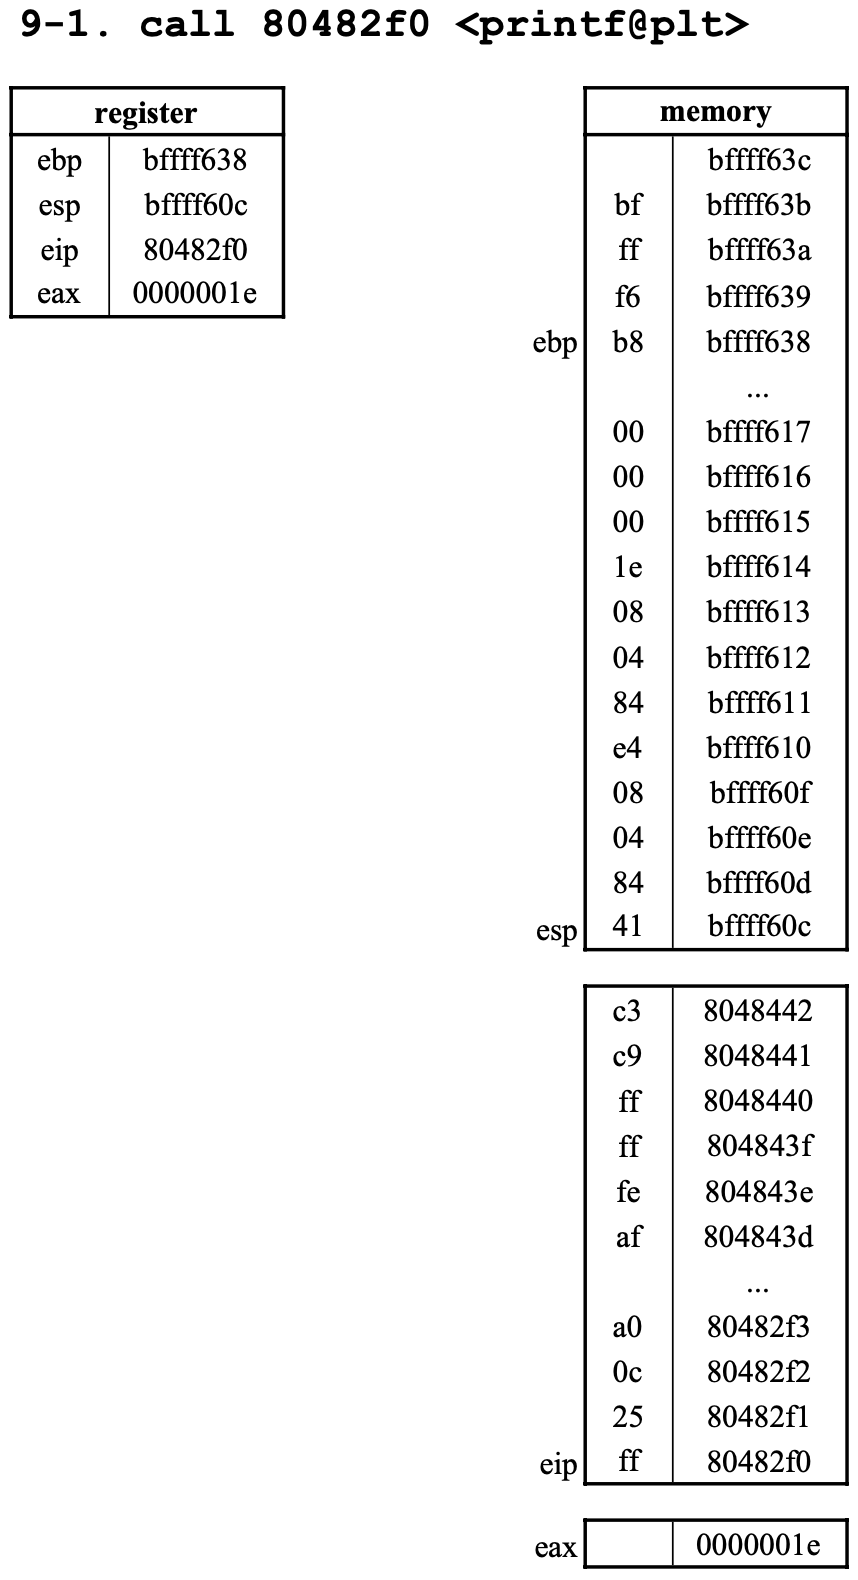
0x80482f0에 있는 코드 실행 전,- 돌아올 주소 (return-addr) 즉,
call명령어의 다음 명령어의 위치인0x8048441를push한 후 0x80482f0로jump한다.push과정에서esp는 4만큼 감소되고,esp가 가리키는 메모리에0x8048441가 기록되며,jumpto0x80482f0로 인해eip는0x80482f0로 업데이트된다.- 그 후
0x80482f0에 있는<printf@plt>의 명령어를 실행하기 시작한다. <printf@plt>asm 코드는 아래와 같다.
080482f0 <printf@plt>:
 80482f0:       ff 25 0c a0 04 08       jmp    DWORD PTR ds:0x804a00c
 80482f6:       68 00 00 00 00          push   0x0
 80482fb:       e9 e0 ff ff ff          jmp    80482e0 <_init+0x2c>
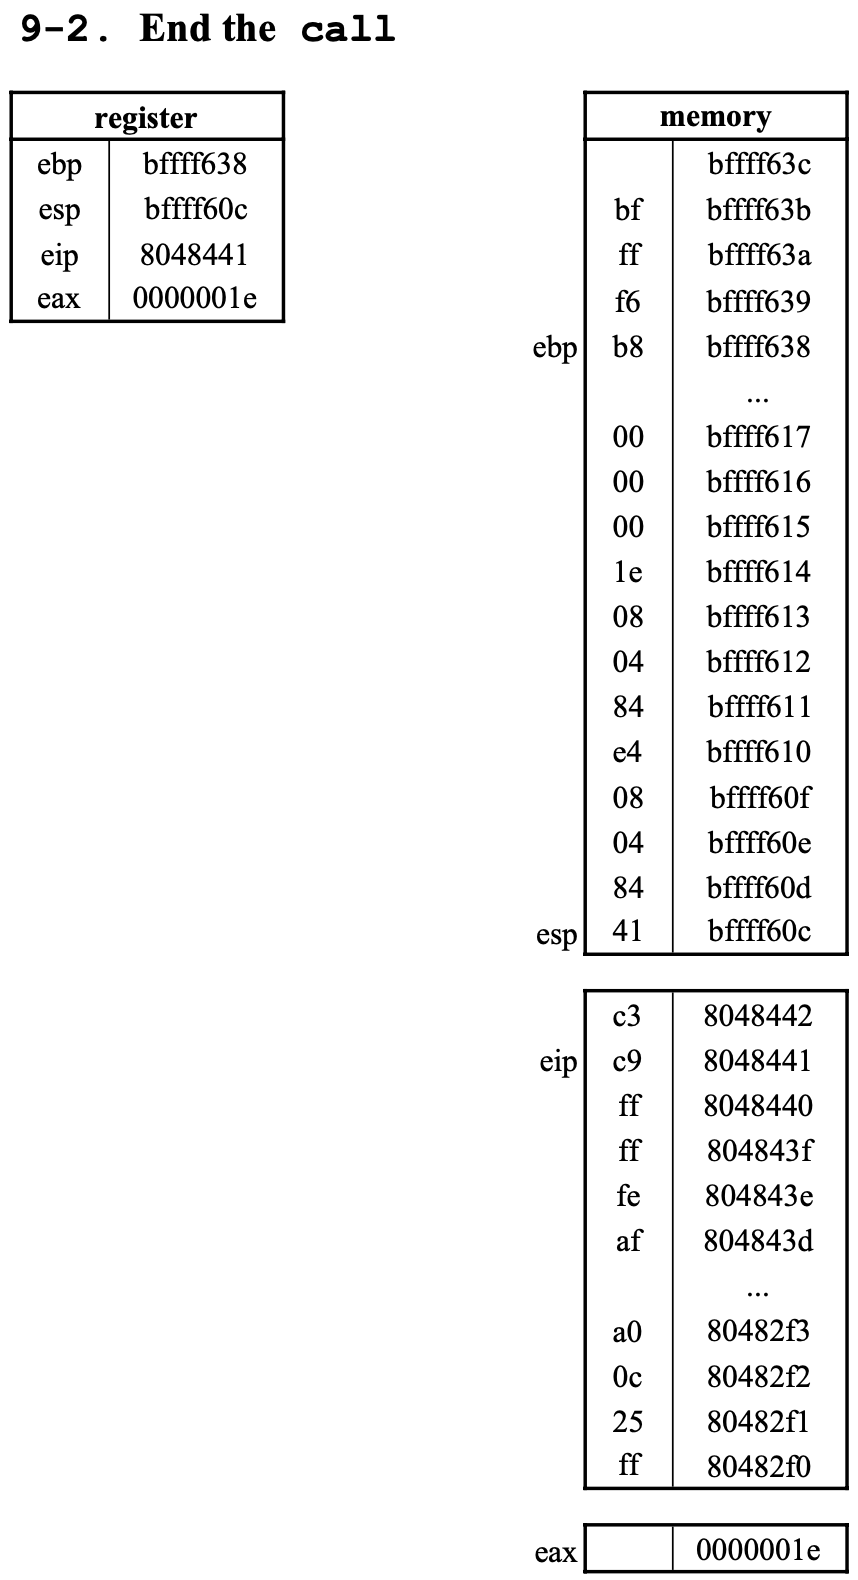
call이 종료되면eip는esp에 저장해둔0x8048441로 이동한다.
10. leave
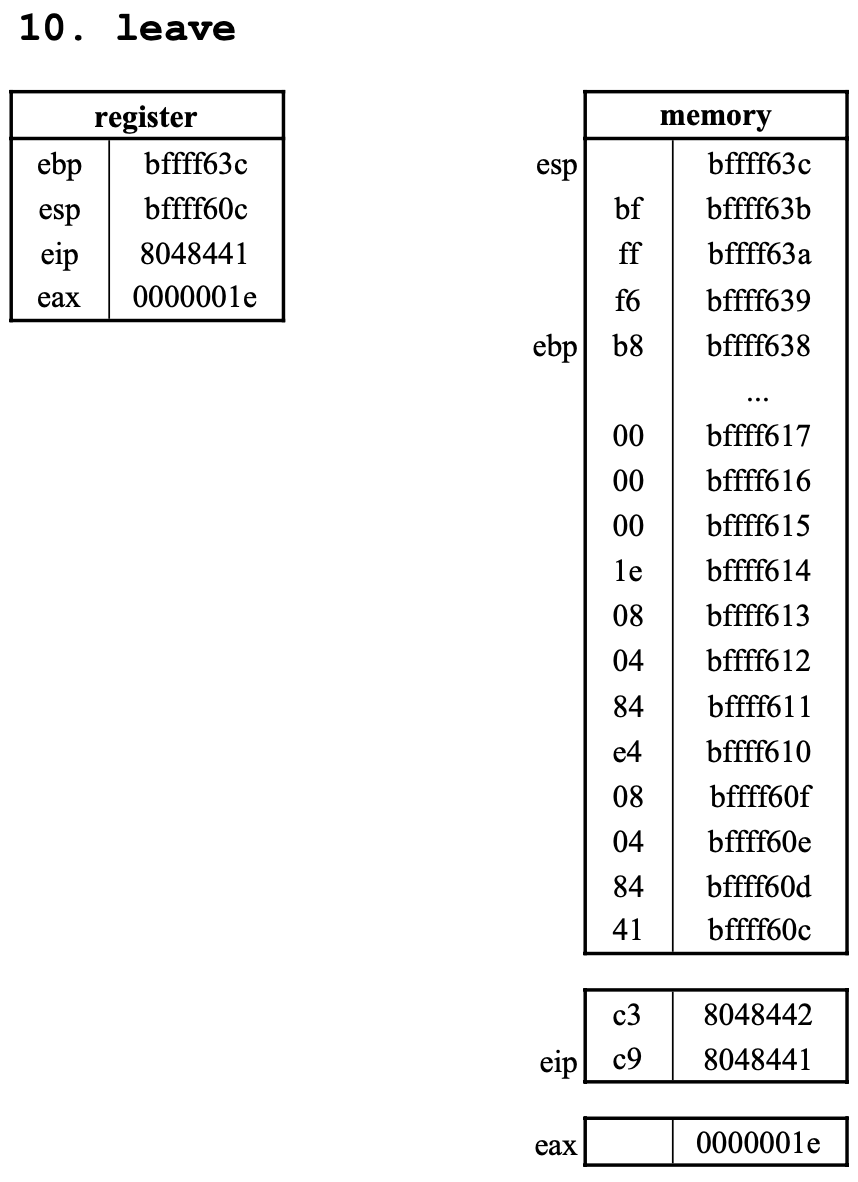
- 먼저
move esp, ebp를 수행하여esp와ebp에bffff638이 저장된다. (ebp -> esp = ebp) - 이어서
pop ebp를 수행하여ebp에esp가 가리키는 메모리에 기록된 data를ebp에 기록한 후 esp를 4byte만큼 증가시켜esp는bffff63c이 된다.
11. ret
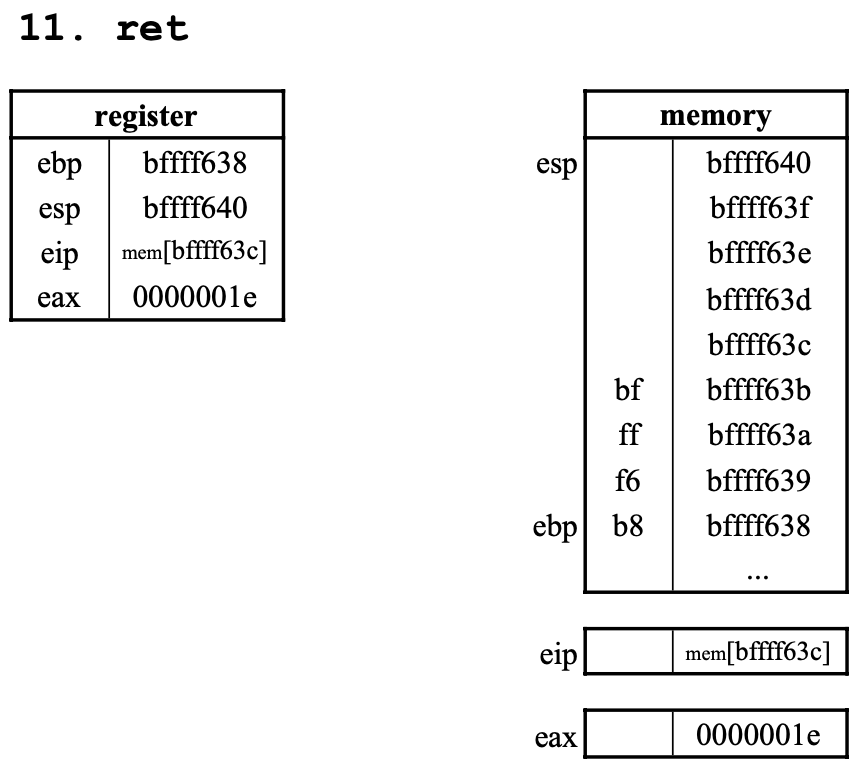
eip를 현재esp인bffff63c가 가리키는 return address로 이동시키고esp의 값에 4를 더한다.- (
esp가 가리키는 위치에 있는 값을 알 수 없기에 정확한eip값은 알 수 없다.)
(4) Find corresponding instructions for x=30; and printf("x is %d\n",x); in the ASM code.
x=30;
x=30;에서 10진수 30을 16진수로 변환하면 0x1e이다.
<main> asm 코드에서 1e를 찾아보면 아래와 같다.
0804841c <main>:
 ......         ......                  ...    ......
 8048425:       c7 44 24 1c 1e 00 00    mov    DWORD PTR [esp+0x1c],
 ......         ......                  ...    ......
0x08048425에서 mov DWORD PTR [esp+0x1c] 이므로 esp+0x1c에 30을 저장 한다. 즉, c7 44 24 1c 1e 00 00가 x=30;을 나타낸다.
printf("x is %d\n",x);
0804841c <main>:
 ......         ......                  ...    ......
 804842d:       8b 44 24 1c             mov    eax,DWORD PTR [esp+0x1c]
 8048431:       89 44 24 04             mov    DWORD PTR [esp+0x4],eax
 8048435:       c7 04 24 e4 84 04 08    mov    DWORD PTR [esp],0x80484e4
 ......         ......                  ...    ......
80484e4를 확인하면 아래와 같다.
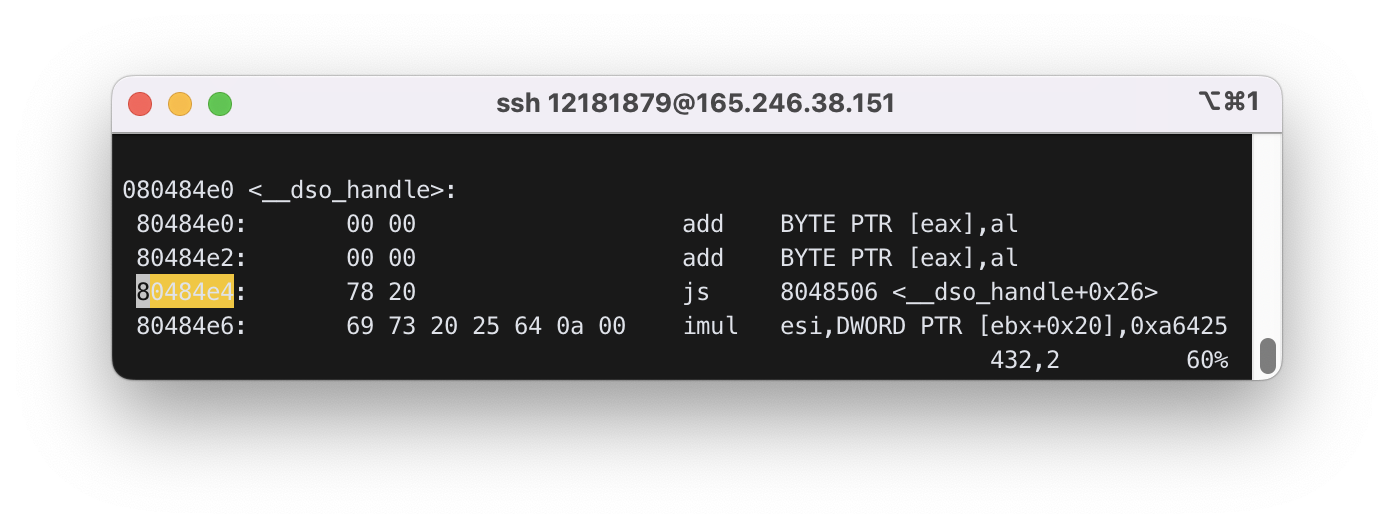
78 20 69 73 20 25 64 0a 00을 해석하면 다음과 같다.x [space] is space %d LF이다.esp의 주소 공간에 문장을 저장한다.0x08048431에서는x를 저장,0x08048435에서x [space] is space %d LF를 저장,0x0804843c에서print를 호출 하는 것을 알 수 있다.
(5) What is the memory location of the variable x?
0804841c <main>:
 ......         ......                  ...    ......
 8048425:       c7 44 24 1c 1e 00 00    mov    DWORD PTR [esp+0x1c],
 ......         ......                  ...    ......
위 Exercise (4)와 동일하게 esp + 0x1c인 것을 알 수 있다.
(6) Find the memory address where the string "x is %d\n" is stored. Confirm the ascii codes for "x is %d\n" at that address.
- 위 Exercise (4)와 동일하다.
78 20 69 73 20 25 64 0a 00을 해석하면 다음과 같다.x [space] is space %d LF이므로0x080484e4,0x080484e6에 저장 되는 것을 알 수 있다.
(7) Show the memory address where main() begins.
<main> asm code를 확인해보면 0x0804841c가 메모리 주소인 것을 확인할 수 있다.
4. Debugging
1. compile with -m32 (for 32 bit environment) and -g (for gdb) option
$ gcc -m32 -g -o ex1 ex1.c
2. copy .gdbinit to configure gdb
$ cp ../../linuxer1/.gdbinit .
3. run gdb
$ gdb ex1
     ....................
gdb$ set disassembly-flavor intel  # to see asm output in intel syntax
gdb$ disassemble main              # disassemble main() and show asm code for main
Dump of assembler code for function main:
     0x804841c <+0>:  push ebp          # first instruction of main
     ....................
End of assembler dump.
gdb$ display $esp # display the value of esp after each ni
gdb$ display $ebp
gdb$ display $eax
gdb$ b *0x804841c # set break point at addr=0x804841c (first instr addr of main)
     ....................
gdb$ r # start running the program
[0x002B:0xFFFFD5EC]------------------------------------------------------[stack]
0xFFFFD63C : 20 83 04 08 00 00 00 00 - F0 5D D0 44 79 D7 D2 44  ........].Dy..D
0xFFFFD62C : 00 00 00 00 00 00 00 00 - 00 00 00 00 01 00 00 00 ................
0xFFFFD61C : 00 00 00 00 00 00 00 00 - 5D 83 CC CE 2B 26 D7 94 ........]...+&..
0xFFFFD60C : 02 00 00 00 02 00 00 00 - 00 60 EC 44 00 00 00 00 .........`.D....
0xFFFFD5FC : B0 C6 FF F7 01 00 00 00 - 01 00 00 00 00 00 00 00 ................
0xFFFFD5EC : 65 D8 D2 44 01 00 00 00 - 84 D6 FF FF 8C D6 FF FF e..D............
--------------------------------------------------------------------------[code]
=> 0x804841c <main>:    push   ebp
   0x804841d <main+1>:  mov    ebp,esp
   0x804841f <main+3>:  and    esp,0xfffffff0
   0x8048422 <main+6>:  sub    esp,0x20
--------------------------------------------------------------------------------

Breakpoint 1, main () at ex1.c:2
2       void main(){
3: $eax = 0x1
2: $ebp = (void *) 0x0
1: $esp = (void *) 0xffffd5ec

gdb$ ni # execute next instruction ("push ebp")
gdb$ ni # execute next instruction ("mov ebp, esp")
gdb$ ni # execute next instruction ("and esp, 0xfffffff0")
     ....................
gdb$ ni # execute "sub esp, 0x20"
     ....................
gdb$ ni # execute "mov dword ptr [esp+0x1c], 0x1e
gdb$ ni # execute "mov eax, DWORD PTR [esp+0x1c]
     ....................
gdb$ ni # execute "DWORD PTR [esp+0x4], eax
     ....................
gdb$ ni # execute DWORD PTR [esp], 0x80484e4
     ....................
gdb$ si # execute "call printf" with si to enter the function
Exercise
(8) Follow above steps to show the content of the registers or memory that have been changed after each instruction in main(). You should indicate the changed part in your picture (the captured output screen from gdb) for all instructions one by one. For “call” instruction use si command to enter the function and show the changes in the stack and register.
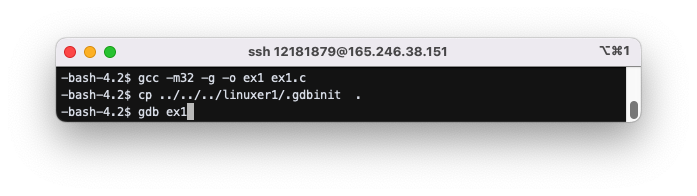
컴파일 시, -g 옵션을 추가하여 debug가 가능하도록 하였다.
.gdbinit 을 복사 후 gdb를 실행하였다.
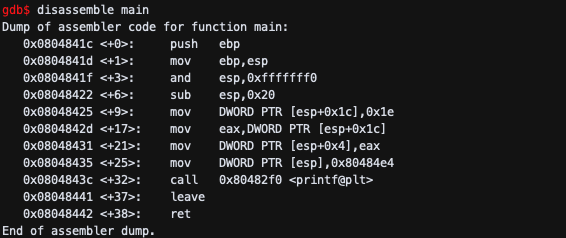
set disassembly-flavor intel로 ASM이 intel format으로 출력이 되도록 하며, disassemble main 명령어로 main의 ASM 코드를 확인하였다.
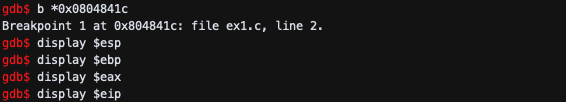
break point를 main 함수의 메모리 주소인 0x0804841c로 하였다.
display $esp, ebp, eax, eip로 명령어를 실행 할 때마다 값이 출력 되도록 하였다.
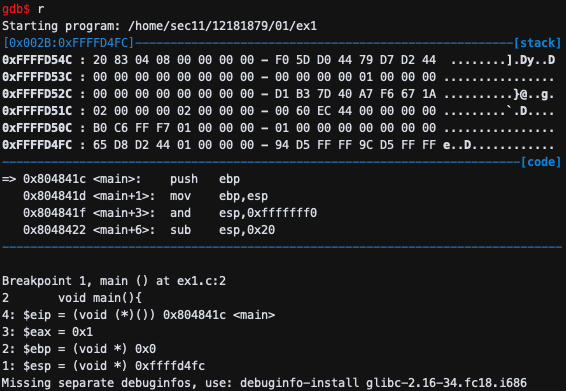
r로 디버깅을 시작 했으며, 0x804841c에서 breakpoint를 만나 멈췄으며, stack과 ASM code를 확인 할 수 있었다. 그리고 설정한 eip, eax, ebp, esp 값을 확인 할 수 있었다.
ni로 다음 줄을 실행 하였다.
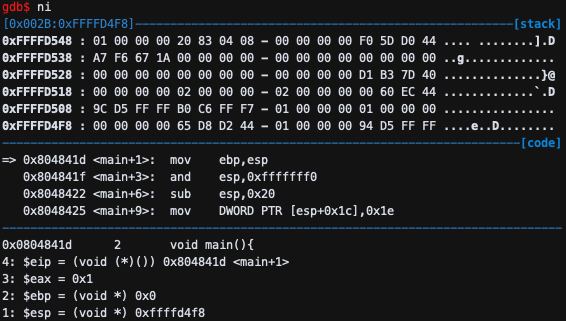
push ebp는 1) esp = esp-4, 2) ebp = esp
의 과정을 거쳐 esp가 4만큼 감소 감소하며, eip가 이동 한 것을 알 수 있다.
그리고 stack 0xffffd4f8에 00 00 00 00이 된 것을 알 수 있다.
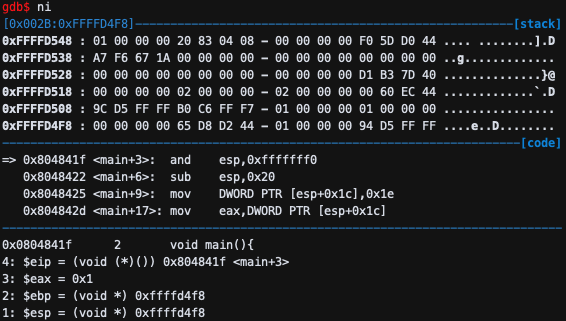
and esp,0xfffffff0 esp 가 esp and 0xfffffff0의 값 (0xffffd4f8)을 가지게 된다.
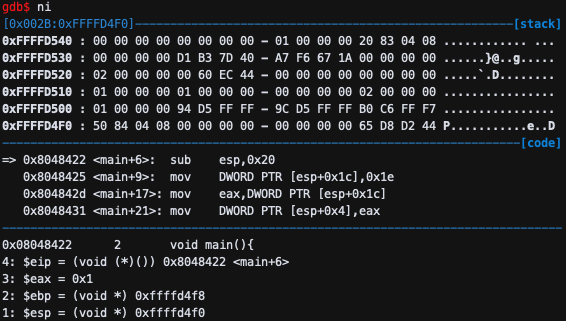
sub esp,0x20 명령어로
esp가 esp-0x20 값을 가지게 된다. 그러므로 esp는 0xffffd4f0이 된다.
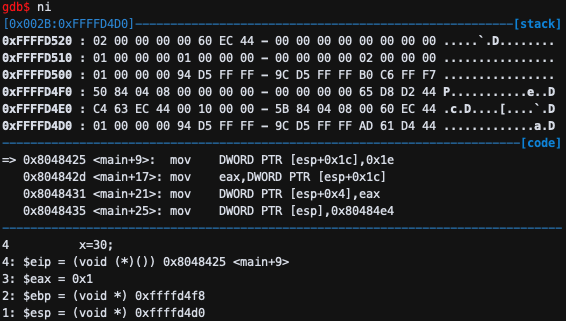
mov DWORD PTR [esp+0x1c],0x1e이므로 4byte에 0x1e를 저장한다.
[esp+0x1c]에 0x1e가 저장 되는 것을 알 수 있다.
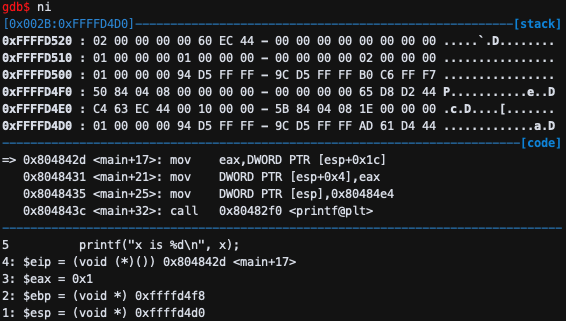
mov eax,DWORD PTR [esp+0x1c]이므로 [esp+0x1c] 부분에 0x1e 값이 채워져있었기 때문에, eax 값이 30(0x1e)이 된다.
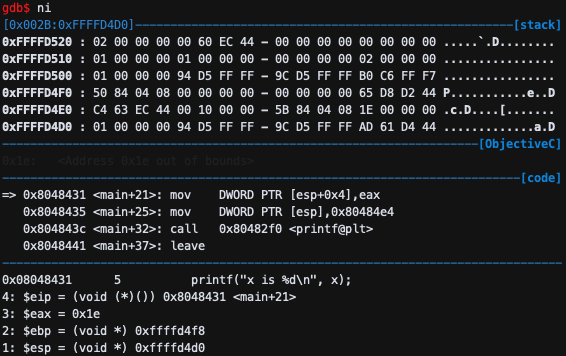
mov DWORD PTR [esp+0x4],eax이므로 [esp+0x4]에 eax를 저장한다.
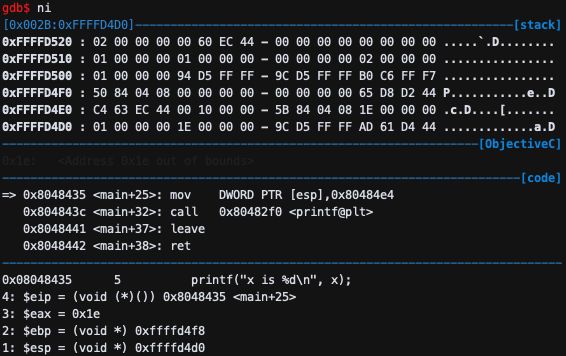
mov DWORD PTR [esp],0x80484e4이므로 esp 위치에 0x80484e4를 저장한다.
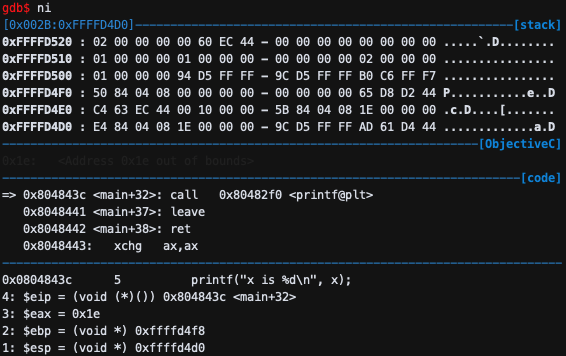
call 0x80482f0 <printf@plt>이므로 우선 esp가 4 감소 하며, return address 0x08048441를 저장
한다.
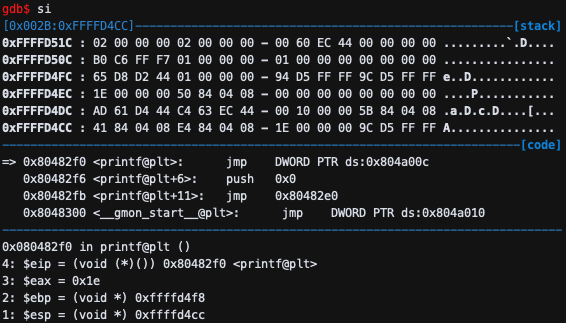
jmp DWORD PTR ds:0x804a00c
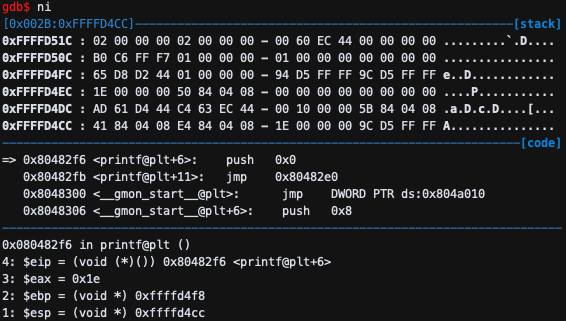
push 0x0이므로 esp-4(0x0)이 저장 되는 것을 알 수 있다.
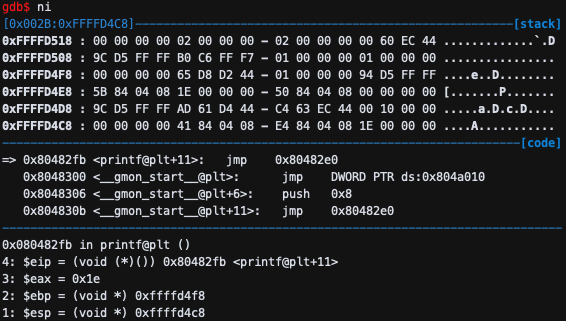
jmp 0x80482e0이므로 eip가 jump한다.
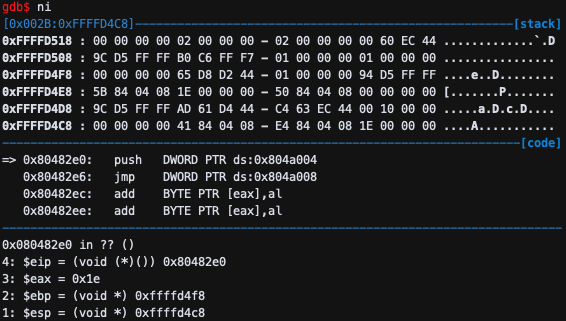
push DWORD PTR ds:0x804a004이므로 esp는 4가 내려가며 stack에 저장된다.
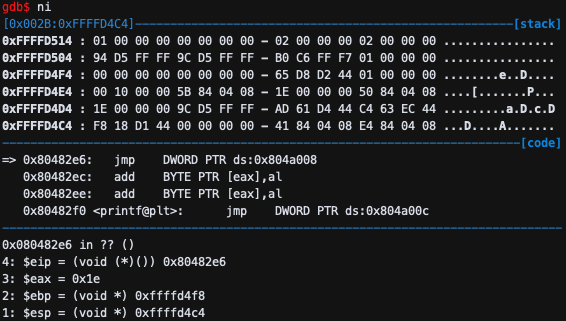
jmp DWORD PTR ds:0x804a008이므로 eip가 jump한다.
5. gdb commands
gdb$ b *addr        # break at addr
gdb$ b funcname     # break at function "funcname"
gdb$ r              # rerun
gdb$ bt             # backtrack stack frames
gdb$ p expr         # print the value of expr ex) p $sp or p/x $eax (in hexa)
gdb$ nexti          # run next instruction (do not go into a function). same as ni.
gdb$ stepi          # run next instruction (go inside a function). same as si.
gdb$ info f         # show the stack frame of the current function
gdb$ display $eip   # show the value of eip after every gdb command
gdb$ display $esp   # show the value of esp after every gdb command
gdb$ info registers # show the value of all registers
gdb$ info registers eip # show the value of eip
gdb$ info line      # memory address of the current function
gdb$ info line main # memory address of function main
gdb$ x/8xb addr     # show 8 bytes in hexa starting from addr
gdb$ x/20xh addr    # show 20 half words (2 bytes) in hexa starting from addr
gdb$ x/13xw addr    # show 13 words (4 bytes) in hexa starting from addr
6. 64-bit Linux shows different output compared to 32-bit Linux
- It uses 8-byte registers (
rsp,rip,rbp, …) instead ofesp,eip,ebp, … - The calling convention (how to pass function arguments) is different.
- 64-bit Linux passes function arguments in registers instead of stack:
- The first six integer or pointer arguments are passed in
rdi,rsi,rdx,rcx,r8,r9(in that order left to right), while xmm0, xmm1, xmm2, .., xmm7 are used for floating point arguments. - Additional arguments are passed on the stack and return value is stored in rax.